After my traffic numbers from 2011 and 2012, let’s now move to 2013 – when I published a total of 46 articles.
Overall Traffic
Similar to the previous article, let’s start with a high level view of the traffic on baeldung – January to August 2013:
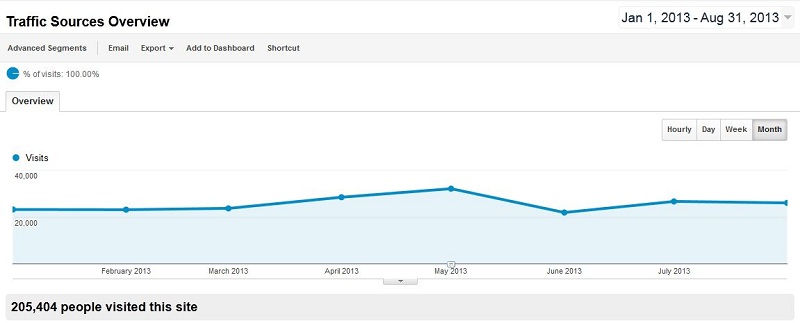
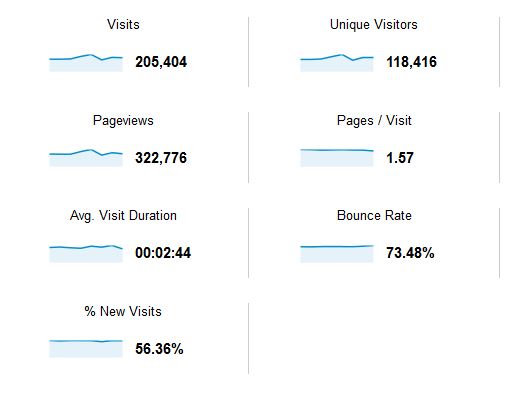
The stats of 2013 have degraded slightly since 2012:
Search Traffic
On to the 2013 search traffic – as you can see, that has been very much stable, hovering at around 15000 visits a month.
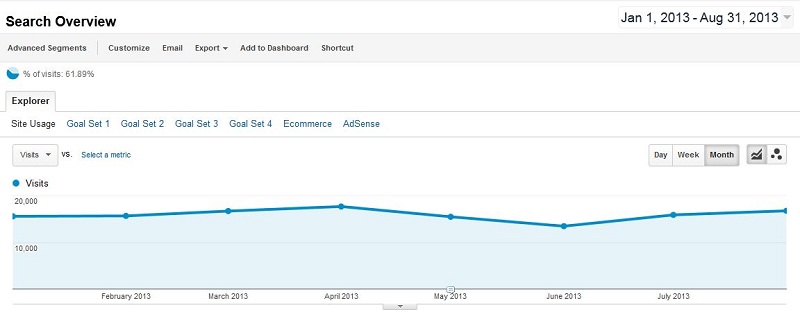
Compared to the earlier numbers, search has now grown the be roughly 62% of my traffic.
Top Referrers
Let’s now move to the more interesting data – who is generating traffic for my site:
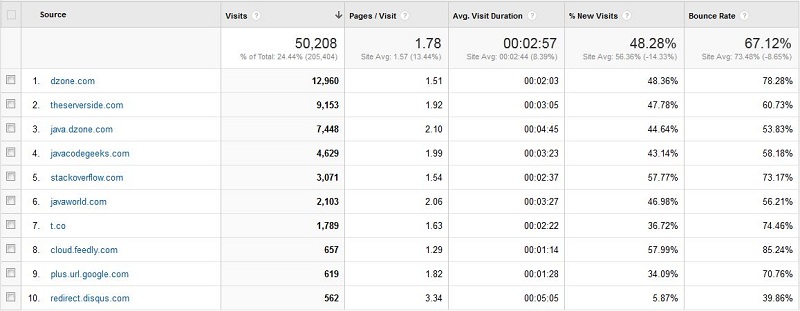
Now, one thing to note here is that, around mid May, I decided to stop syndicating my articles to community sites such as theserverside. This has of course resulted in a significant drop of traffic coming from these sites – for example, this is my traffic from theserverside:
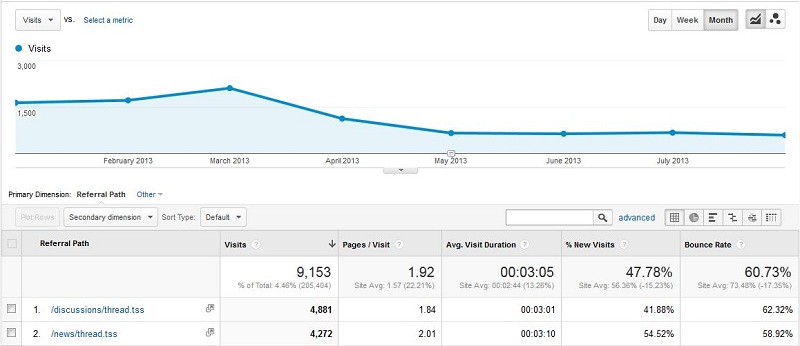
An interesting referrer stands out from my top 10 – Feedly – so it looks like Feedly came out on top after the shutdown of Google Reader.
Another one to note is Disqus – I wouldn’t have predicted that what is essentially a commenting system would drive significant traffic to my blog – but it clearly does.
Finally, Google+ has also made my top 10 in 2013 – which wasn’t the case in 2012.
Takeaways
This is the data right for the first 8 months of 2013 – which brings up to September. From now on – I’ll publish results in the standard monthly cadence. I will include earning results if I choose to add ads to the blog at some point.
Now that traffic data is out, I’ll focus on publishing the results of my first public A/B test – when that data is ready. Stay tuned.